FInance and IT Experts
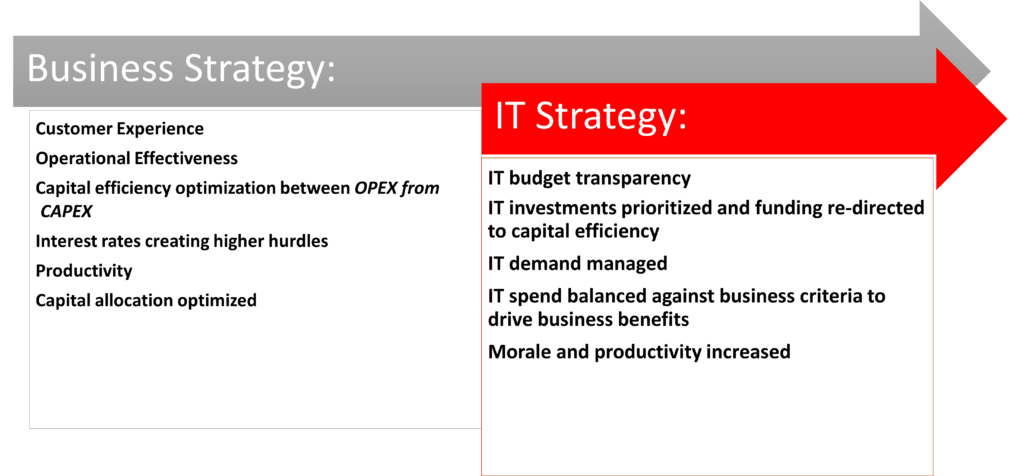
Applying a Business Strategy Framework to IT Investment Planning
IT funding to cash-cows focused primarily on compliance and regulatory. Dogs would also receive funding for efforts to improve the sale prospects of the operation
Question marks receive dedicated funding for proof of concepts and innovation to support efforts to transition the business to a star or a cash-cow
Stars would receive funding and IT capabilities that align to the business’s growth

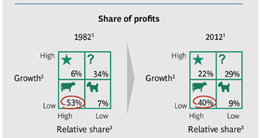
The horizontal axis of the BCG Matrix represents the amount of market share of a product and its strength in the particular market. By using relative market share, it helps measure a company’s competitiveness.
The vertical axis of the BCG Matrix represents the growth rate of a product and its potential to grow in a particular market.
In addition, there are four quadrants in the BCG Matrix:
- Question marks: Products with high market growth but a low market share.
- Stars: Products with high market growth and a high market share.
- Dogs: Products with low market growth and a low market share.
- Cash cows: Products with low market growth but a high market share.
The assumption in the matrix is that an increase in relative
market share will result in increased cash flow. A firm benefits from
utilizing economies of scale and gains a cost advantage relative to
competitors. The market growth rate varies from industry to industry but usually shows a cut-off point of 10% – growth rates higher than 10% are considered high, while growth rates lower than 10% are considered low.
SALEK CONSULTING

